We all have these amazing machines in our development and testing labs, and we know that our real users do not share this wonderful world. They experience our products very differently from us.
These differences result in two major challenges:
We do not know what the users experience
We cannot debug their machines
As a Video Advertisement Player team, these challenges are multiplied. Why?
Our product is a third party script that serves other third party scripts for websites.
Your code runs on different platforms
As a third party web product, you do not know which websites your code runs on.
Websites have a variety of frameworks, architectures and styles.
Frameworks – change the browser’s core behavior, for example, redefining methods, which challenges the product’s basic behavior.
Architectures – affect the website’s performance, which impacts on the product’s natural flow.
Styles -manipulate the product’s look and feel.
Running someone else’s code
When your product serves other third party scripts for websites, you neither know how they will perform, nor can you tell their impact on the website.
Scripts affect website performance, behavior and style. So…what can we do?

Elasticsearch and Kibana to the rescue
Elasticsearch provides a full text search engine, with an HTTP web interface and schema free JSON documents.
Kibana is an open source data visualization plugin for Elasticsearch. It provides visualization capabilities, on top of the content indexed in an Elasticsearch cluster.
These are big words, how do we use them?
Elasticsearch logging
We define and log our product’s stories, and their combination creates the product funnel.
Stories, are your product split into separated areas and flows.
Our product’s stories are defined by the different interactions the product performs:
- Interacting websites – publishers
- Interacting third party script – advertisers
- In-product business logic
That sounds great! How does it work?
Publishers
Our publishers want to increase their revenue from video ads.
Platform, machine, website performance and framework existence – this data is logged while interacting with the publisher.
The Video Autoplay capability is required for an advertisement to be played on a website.
Logging and debugging sessions allow us to reproduce non-played video ads.
The result is a browsers’ list, which requires a non-regular solution for playing video ads.

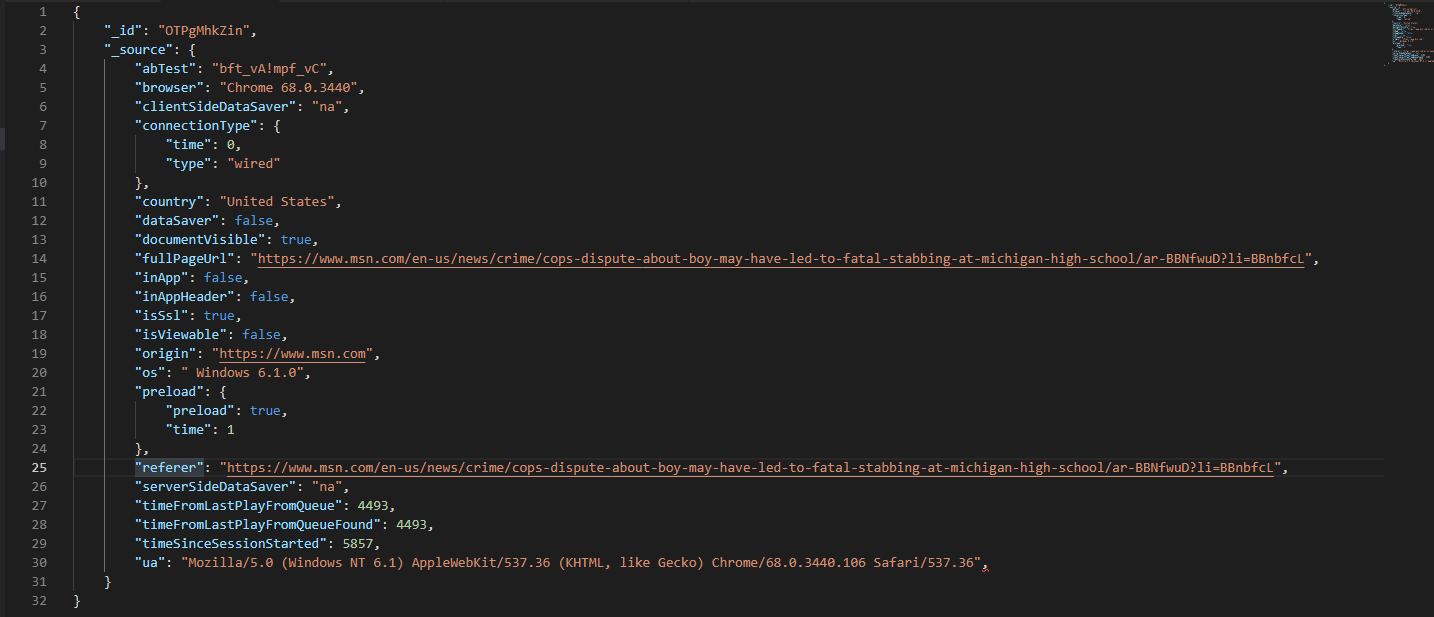
Publisher and user raw data
Advertisers
Our advertisers’ interest is in displaying noticeable ads.
Loading time, malicious behavior, network load and impact on the page style – this data is logged while interacting with the advertiser.
Advertisers might be trying to steal the user’s attention, and they do so by hijacking the page’s scroll and forcing sound. This allows them to increase their viewability and noticeability.
Logging and debugging sessions let us know how it’s done and which methods are programmatically called.
The result is implementing defenses against this kind of malicious behavior.

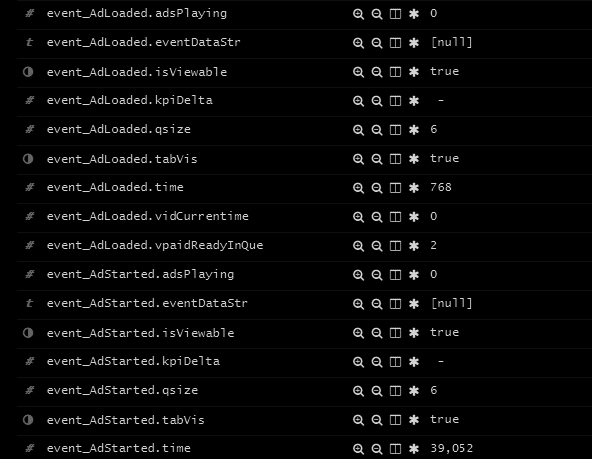
Ad interaction logged events
In-product business logic
Our interest is to keep playing the most profitable ad whenever we can and to reduce calls to the ads server.
Interacting with the ads server, ads’ life-cycle and choosing which ad to play – this data is our product’s business logic.
Logging and debugging sessions reveal ads’ media types which are not supported.
The results are improving the mechanism that chooses the next ad to play.

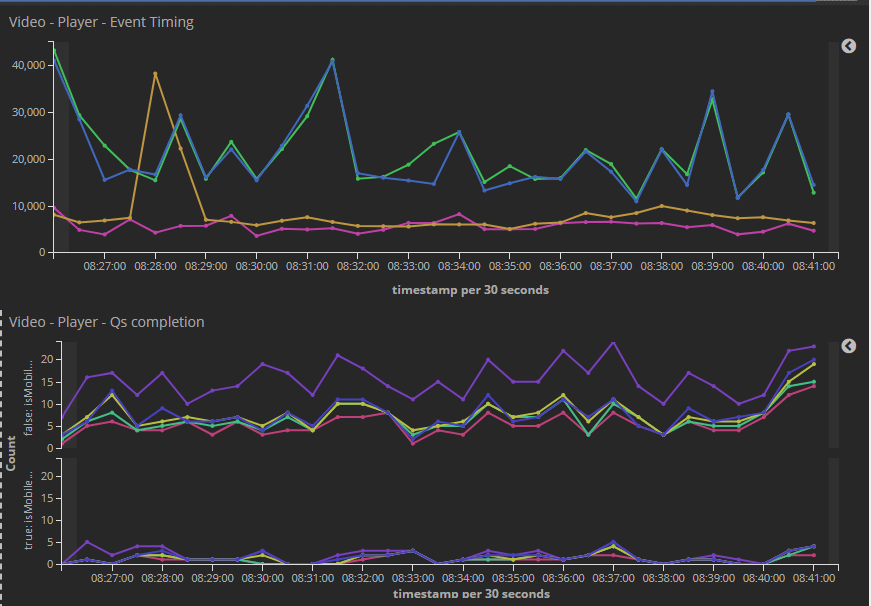
Ads lifecycle and metrics
Conclusion
Elasticsearch and Kibana help us analyze and reproduce real life sessions. A glimpse of this was mentioned above.
Log new business logic and product’s events is all you need for maintaining your data relevance.
Lacking the knowledge of your users’ experience is a liability. Thus reproducing and debugging your users’ sessions in your labs is an asset.


