Taboola is the leading recommendation engine in the open web market, serving close to 1 million requests per second during peak while keeping p99 response time subsecond. During recommendation flow, caches are heavily utilized to boost performance, save complicated computation, and reduce load to external data stores. In Taboola, we build cache services based on memcached and have a memcached cluster per data center dedicated to recommendation flow. These memcached clusters serve over 10 million requests per second.
In this article, we discuss one particular case where our memcached cluster network got saturated and became unstable.
The problem
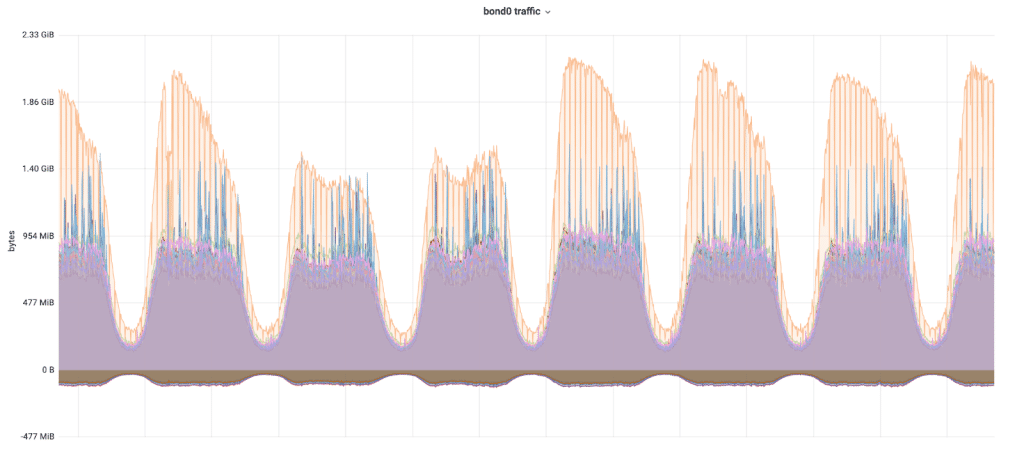
As Taboola continues to grow (Yahoo partnership, Apple News and Stocks, and many more), so are our recommendation requests. In turn, our memcached cluster powering recommendation requests starts to face a skewed access pattern as illustrated by the graph below.  Each line represents a memcached node – positive for transmit traffic and negative for receive traffic. In particular, the orange line is a skewed node with much higher network traffic than others. And network traffic of the skewed node is saturated to a point that clients connecting to the node start to encounter occasional, unpredictable packet loss.
Observability into cache distribution
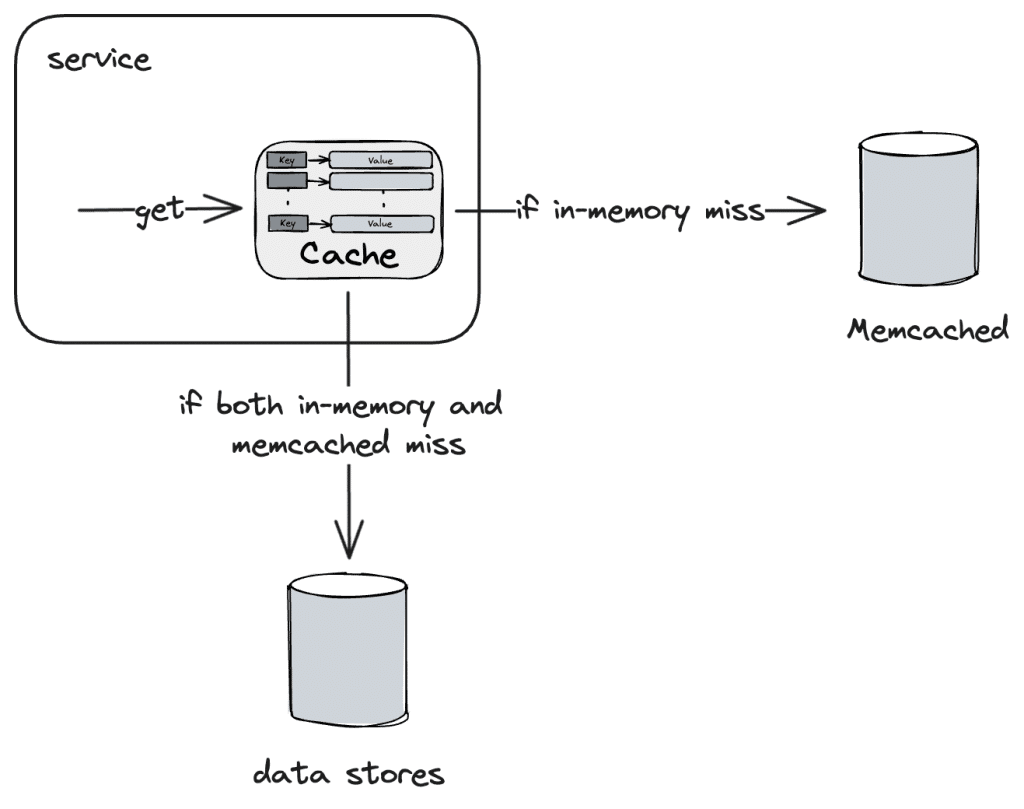
Before we dive into the issue, we need to understand how cache in Taboola works. As a simplified flow, clients see read-through cache while there are two layers of cache underlying – in-memory cache and memcached.
- Access to caches reaches in-memory cache first.
- If in-memory cache misses, then reach memcached.
- If both in-memory cache and memcached miss, fetch from data stores and/or perform whatever computation necessary.
 In a memcached cluster, each memcached node works independently and is unaware of each other. Cache entry sharding is performed by our clients using consistent hashing. New nodes are added occasionally and in general the number of nodes is relatively stable.
The first theory to the issue is the celebrity problem, i.e., certain entries are hot and accessed much more frequently than others, and thus leads to the skewness. But this is quickly eliminated, since hot entries likely reside in-memory cache all the time and are served in-memory without needing memcached fetch. We also double confirm that no suspicious high evictions among in-memory caches.
Our theory is then turned to skewed cache entry distribution among memcached nodes. Initial check on memory indicates that there are some discrepancies among memory usage of memcached nodes, though much less extreme than network traffic. However, given our memcached cluster serves tens of different caches, skewed entry distribution of one cache or few caches are likely hidden from coarse-grained memory view.
To find the potential skewed entry distribution, we need to be able to analyze per cache entry distribution. While memcached has the tool to dump cache statistics, it’s an aggregated view and has no knowledge of determining which entry belongs to which cache. In order to better understand the entry distribution, first we add a new convention to our cache framework and gradually migrate all of our caches to prefix cache keys with cache names. Second, we utilize memcached lru_crawler to dump cache keys and together with cache name prefix to collect entry distribution per cache. We make this process automatic and feed the statistics into our continuous monitoring pipeline backed by Prometheus.
After the statistics are available, unfortunately none of the tens of caches show skewed entry distribution. On the good side, we ruled out another theory and built another nice observability into our memcached cluster.
Locate the villain
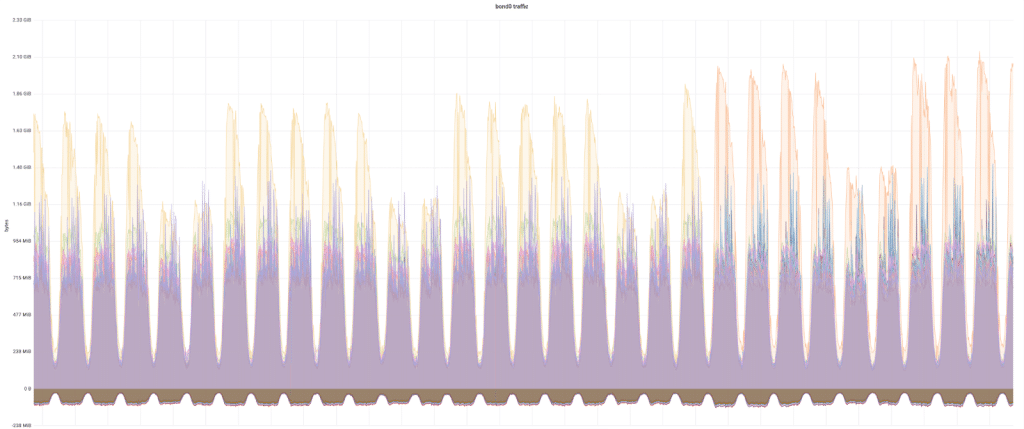
Then something catches our attention – the skewed memcached node shifts from one node to another at a certain time point, as illustrated by the graph below, while it has been consistent on a particular node for a long while already. Looking deeper we realize that the shift timing correlates to the migration of adding cache name prefix to cache keys. While the root cause is still unknown, we now have an easy way to a) validate whether it’s one or few caches causing the issue, and b) find exactly which caches are troublemakers.  The investigation is then straightforward with binary search technique. We divide tens of caches into two groups and perform another cache key tweaking migration on those two groups separately and observe migration of which group leads to skewed node shifting. And from the group having shifting effect, we repeat the process of dividing it further into two subgroups to test shifting effect. After a few interactions, we are able to locate exactly one cache who is causing the skewness.
So now we find the villain, but the puzzle is not yet solved. The problematic cache’s in-memory cache hit rate is ~83%, while not great but also not that bad as well, and its eviction rate is reasonable. Why is it causing the issue then?
The root cause
There are several attempts to address the issue, including reducing the size of largest entries being up to hundreds of kilobytes and some experiments to reduce cache access, but none helps and the skewness persists. Then another anomaly is noticed – while the problematic cache has a reasonable in-memory hit rate, the stale access ratio is >90%.
Stale access is an optional feature in Taboola to help latency. The basic idea behind stale access is simple – in some scenarios where there is contention between latency and data freshness, we can optionally favor latency by postponing data fetch and using slightly stale data. When stale access is enabled, which is the case with the problematic cache, the flow becomes:
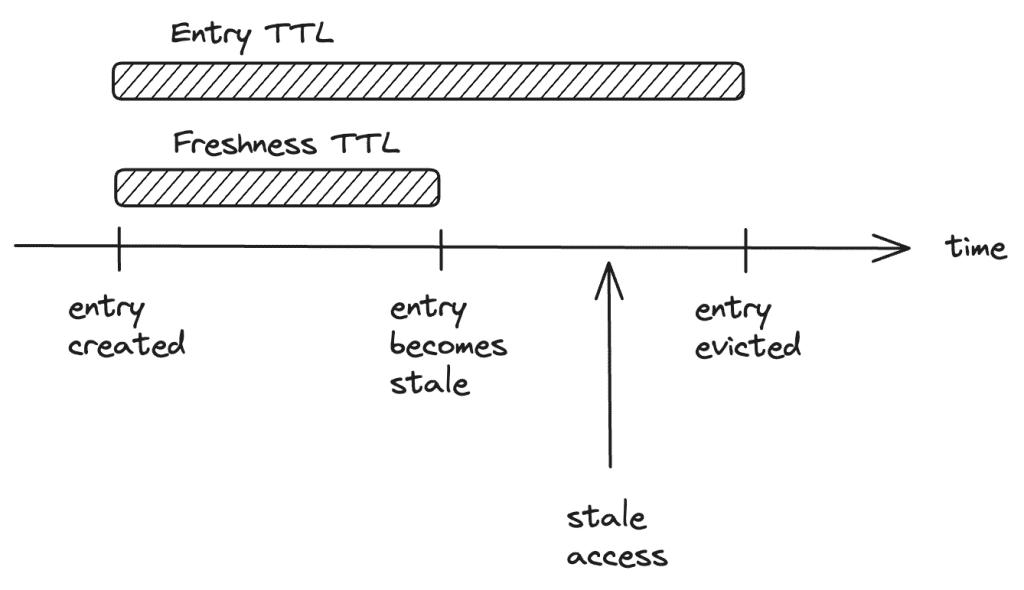
- In-memory cache now has two TTL values, as illustrated in the graph below.
- Freshness TTL to determine whether an entry is considered fresh or stale.
- Entry TTL to determine when an entry needs to be evicted from the cache.
- The invariant is freshness TTL < entry TTL.
- When access to an in-memory cache returns an entry whose freshness exceeds freshness TTL but still within entry TTL, it’s marked a stale access and then the entry is served as usual.
- Meanwhile, a background task is launched to fetch data from memcached and data sources if memcached misses, and then update the fresh copy back to in-memory cache.
 In general we expect stale access ratio to be low, since subsequent access to the same entry of a stale access likely gets fresh data resulting from background update. And high stale access ratio hints that something unexpected is happening. After some digging, it turns out that indeed this is where the bug is!
By convention we assign the same value to both freshness TTL and memcached TTL. But for the problematic cache, there is a bug slipping through leading to memcached TTL being much greater than freshness TTL. This results in the background task of updating stale data from memcached succeeds but it’s updating a stale entry with another stale entry, when entries in memcached exceed freshness TTL. Practically it means stale entries are not refreshed at all until passing memcached TTL. And it also explains the symptom that in-memory cache hit rate is high as stale access is still a hit.
In short, stale entries are not refreshed, resulting in massive stale access, in turn resulting in massive memcached access. This essentially turns the issue into the celebrity problem which we eliminate in the very first beginning, i.e., hot entries are not really buffered in-memory and majority of access results in memcached access.
With the root cause found, the fix is quite trivial. After the fix is applied, the network traffic of the skewed node is reduced to one fifth and the skewness is resolved, as illustrated in the graph below. 
Conclusion
This exploration shows a simple issue becomes challenging when it’s live on production with millions of access per seconds and tens of different clients involved. We hope you enjoy reading this problem-solving journal with us and find values in techniques we used to solve this particular problem.


