
Monitoring your content marketing ROI allows you to pinpoint what aspects of a marketing campaign are or aren’t working. It’s the ratio of your net profit to your content costs.
If you are doing content marketing at your company, you need to be able to prove that the cost of content creation is worth it. To get there, you need a system to measure the return on investment, or ROI, of the content you create and distribute.
Today we’ll dive into exactly how to calculate ROI for your content marketing efforts, with step-by-step instructions on how to pull the metrics that matter. We’ll also share some content marketing tips and best practices along the way.
Content Marketing ROI: What Does It Mean?
If you can’t answer this question, you’re not alone. Whether your content marketing is meant to impact brand awareness, performance marketing, revenue, or something in between, measuring the ROI of content marketing can be a lot less black and white than it is for other types of marketing.
In a nutshell, ROI is the ratio of your net profit to your investment cost. In content marketing terms, ROI is a comparison of the cost of creating and distributing content, versus the net profit that results from those efforts expressed as a percentage.
Those are the relevant factors in ROI, even if your goal is something more intangible, such as increasing brand awareness. Companies know that good brand awareness campaigns will eventually impact their bottom line for the better. If you can prove your campaign has achieved this end, you’ve proven the worth of your work.
The Importance of Measuring the ROI of Content Marketing
ROI is essential to determine whether or not your content marketing efforts have an impact on your business goals, prioritize what the endless list of potential content projects to focus on, and effectively communicate your successes to your executive team. In order to measure your content marketing ROI, you need to know how much you’ve spent to create and distribute content and how much revenue came in.
Calculating ROI in Content Marketing: Formula and Challenges
You may have heard the phrases, “we’re ROI positive,” or “we’re ROI negative.” On the most basic level, being ROI positive means more money came in then went out — your ROI is at least 1%. ROI negative is the exact opposite, more money went out than came in — your ROI is -1% or lower. If your ROI is 0%, you broke even.
Here’s a simple ROI formula to illustrate this calculation:
ROI = [Net profit/Cost of investment] x 100
The formula itself is simple. Defining its components can be difficult.
Take for example, the cost of investment. How much does it cost you to create a single blog article? Assuming you wrote it yourself, it’s free, but is it really?
- How much did your company spend in hours for you to write that post?
- Did others review it? How much time did they spend?
- Were custom images created by designers? How much time did they spend?
- Where was it published? Do you own that domain? How much does it cost to own it?
- Did you pay to distribute it, perhaps on publisher sites or social media channels? How much did you spend?
The real ROI of your content marketing efforts will take all of this into consideration when determining how much it really costs to create and distribute something and how this connects to your performance marketing efforts.
When it comes to measuring the return though, all you have to do is track how many people read the blog post and then made a purchase. Right? Unfortunately, no. Often, people need to do more than just read a single blog post in order to make a purchase.
Attributing revenue to a blog article means considering revenue in (at least) two different buckets:
- Sales that can be attributed to that blog article only, meaning that person read that one single article, did not interact with your company in any other way, and then made a purchase.
- Sales that were influenced by content, meaning that person read your blog article and made a purchase, but maybe they visited other pages of your website and interacted with a sales person before they did so.
Scenario #1 will be few and far between, whereas scenario #2 is much more likely. Because of this, it’s hard to pinpoint content marketing’s ROI without advanced lead scoring, which is the process of scoring a person’s interactions with different marketing assets to quantify their value in the purchase journey. If you’re not set up for lead scoring, don’t be discouraged. You can still track the ROI of sales your content has influenced, as long as you discuss it in those terms.
Ultimately, your ROI is a result of a lot of activity — it’s the result of people hearing about you for the first time, finding your content, engaging with it, becoming a lead and eventually making a purchase. Measuring your content marketing efforts means measuring content’s impact at each of these stages.
Preparing for Content Marketing Success
For content marketing to be successful, you have to have a documented content marketing strategy, which in short, is a list of high-level goals you want your content marketing efforts to support and plan for reaching them.
To name a few high-level goals:
- Change people’s perception of my product for the better.
- Create more leads.
- Increase the number of potential customers that know about us.
- Generate more sales.
You might embark on several types of content marketing to get there, from blog articles to video channels to an Instagram handle, and more. But in order to achieve these goals, you’ll want to measure certain metrics to allow you visibility into whether or not you’re on track.
But you need a strategy first. Once you know why you do content marketing, the key metrics should fall into place.
High Level Metrics to Measure Your Content Marketing ROI
Once you’ve set your goals, it’s time to dive into tracking the individual metrics that give you visibility into them. The high-level content marketing metrics that matter most are the following:
- Traffic
- Conversion rate
- Sales and revenue
- Lead generation
- On-site engagement
- Social media engagement
- SEO
- Exposure and authority
- Sentiment
Let’s dive into why these metrics are important, why you should track them and exactly how you can measure them. More content marketing metrics can be explored here.
Organic Traffic
Website traffic is the crux on which lead generation and sales rest. Without people visiting your website and your content assets, there is no one to become a lead or to convert to a sale. Of special interest is organic traffic, which refers to visitors who are directed to your site directly from a search engine rather than by clicking on an ad.
Often considered top of the funnel marketing, the practice of increasing website traffic is the process of connecting more relevant people with your landing pages, whether they be blog articles, product pages, gated content, or another type.
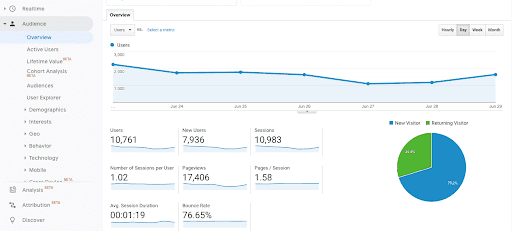
Measuring your website traffic is most easily done in Google Analytics 4.
Important note: In July 2023, Google switched from Universal Analytics (UA) Analytics — the legacy GA product — to Google Analytics 4 (GA4). As of July 2024, you can no longer access Google Analytics Universal data. (Here is Google’s explainer on how to compare metrics between GA (legacy) and GA4.)
In Google Analytics 4, you can see your site traffic by navigating to Reports > Life Cycle > Acquisition > Traffic acquisition. Doing so provides you with a traffic breakdown over time, as well as by URL. This displays data on your traffic, including organic site traffic.
Here’s another screenshot from our example crafting blog:
Digging further into various URLs will allow Bill to determine which articles are performing best for him at this time.
Conversion Rate (CVR)
A conversion rate is the percentage of visitors who completed a conversion (a purchase, pageview, or whichever metric you choose). Google Analytics 4 calculates this by dividing the number of conversions by the total number of sessions.
You can view the conversion rate in a report by going to Reports>Acquisition>Traffic Acquisition and clicking the pencil icon on the upper-right corner to customize your view. This will open a new vertical menu. Under “Metrics,” add “Session Key Event Rate.” This opens another drop-down menu. Select the “Purchase” event.
Sales and Revenue
There’s nothing more powerful to prove the worth of your content marketing efforts than proving an influence or direct impact on sales or revenue.
How you ultimately track your impact on sales or revenue will depend on your marketing tech stack — if your organization uses a customer relationship management (CRM) tool, like Salesforce, HubSpot or Mailchimp, they’ll likely have options for you to connect your Google Analytics 4 dashboard in order to easily display a sales impact on your efforts.
If a CRM dashboard isn’t in the cards, you can use Google Analytics 4 to track your sales impact directly by setting up conversion goals. Goals can include many things, including purchases, form fills, time on site, traffic, and much more.
Here’s an example screenshot from “Bill’s Crafts,” a crafting blog that sells knick-knacks for the home. Bill’s dashboard tracks the number of products sold from a list of URLs on his blog. A quick look at Monetization> Overview shows him which articles are impacting his bottom line the most.
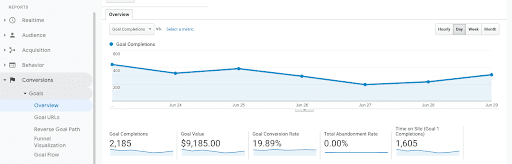
Before becoming a statisticc in this example Google Analytics 4 dashboard, these sales were probably leads first, and the more you can optimize lead generation, the more sales you’ll ultimately drive.
Lead Generation
Many have said it before and I’ll say it again — the purpose of content marketing is to attract a loyal audience, one that raises their hand in some digital way to alert you to the fact that they find your content valuable, and when doing so, alert you to the fact that they should be considered a potential future customer. In other words, a lead.
Lead generation is important to track because your efforts in nurturing them eventually lead to sales, which in turn eventually leads to higher content marketing ROI. The number of leads your content is generating is another metric that can be tracked in a CRM if you have one available, but if not, you can use Google Analytics 4 to do this as well.
This example illustrates how to use funnel visualization in Google Analytics 4 by traveling to Explore > Funnel Exploration > Funnel Visualization to do so.
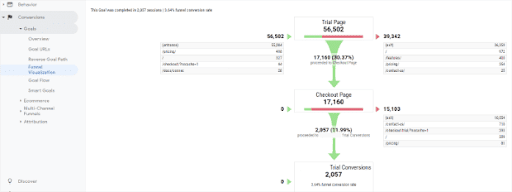
To capture more leads, more people will have to find you first, and for that you’ll need more website traffic.
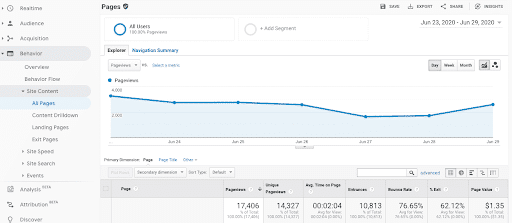
On-site Engagement
On-site engagement is a way of quantifying an answer to the question, “did my audience find my content valuable?” To answer this question, we can look at many different metrics, including:
- Pageviews: The number of times each page was visited.
- Unique visitors: The number of people who visited those pages.
- New vs. returning users: Out of the number of people who visited those pages, how many visited the site previously, and how many were new?
- Behavior flow: If any of those people visited more than one page while they were there, which pages did they visit, and in what order?
- Average time on page: On average, how much time did people spend consuming a piece of content?
- Bounce rate: How many people landed on the page and left without scrolling down?
- Pages per session: On average, how many pages do people visit when they visit your website?
- Traffic sources: Where did these visitors come from?
Each of these is a different way to measure how engaged your audience is. It takes a combination of all of these metrics to paint a true picture of an engaged audience, all of which can be measured in Google Analytics 4.
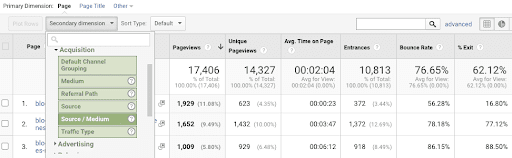
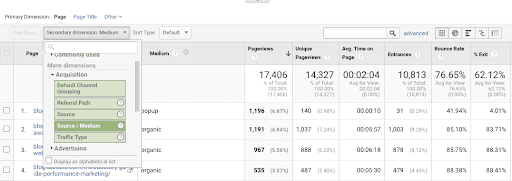
By navigating to Reports > Acquisition > Viewer Acquisition, you can measure most of these metrics:
You can find your traffic sources in Reports > Life Cycle > Acquisition > Traffic Acquisition. Click
the drop-down arrow next to the “Primary Dimension.” Under “Default Channel Grouping,” you will see a list of all the sources of your traffic.
Up until now, we’ve covered all of the major metrics used to analyze content on your own hosted domains, but it’s also important to take into account the performance of the channels you use to drive traffic to your site in the first place.
Social Media Engagement
Social media is a popular channel used to reach audiences where they are online, and drive them back to your website. Using the method we mentioned above, you can easily determine just how much social media drives, but in order to understand how likely your social media audience is to convert to traffic, you’ll need to measure your engagement.
Social media engagement is often measured with the following metrics:
- Followers / new followers: How many people subscribe to your social media updates, and how many of them are new each month.
- Likes, comment and post shares: How many times are people interacting with your posts in a meaningful way?
- Engagement rate: Out of the number of times your posts were seen, how many times was it interacted with?
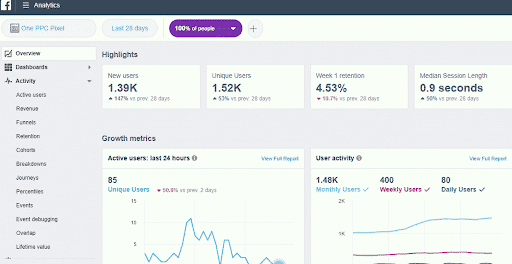
There are many more metrics that you can use to track your social media engagement, depending on how you use social media to meet your goals, all of which can be tracked using popular tools like Contently, Hubspot, Buzzsumo or tracked in the platform themselves. Here’s an example of what that looks like on Facebook, from One PPC:
SEO
Search engines are an incredibly powerful way to find new audiences. If someone is searching for a keyword relevant to the content you’ve created, chances are they’ll find it valuable. The practice of optimizing your content for search engines is called search engine optimization, or SEO. To measure your SEO efforts, you can use Google Analytics 4 to measure organic traffic, using the method described in the previous section.
Exposure and Authority
Measuring your exposure and authority is the practice of finding metrics that determine how many people have heard of your brand, and how influential your brand is to them. To do this, brands create “thought leadership,” which can be blogs, white papers or studies that are cited in the media.
This is one of the hardest metrics to measure, but there are some quick ways to get started:
- Organic impressions: When people search for terms relevant to your business, do they see your content?
- PR coverage: How often is your company or executive team quoted or mentioned in the press?
- Industry events: How often are you asked to speak or attend industry events without paying?
- Sentiment: When people talk about your brand on social media or public forums, are they doing so with positive or negative sentiment?
When people start to recognize your brand as an authority on certain topics, whether online or in-person, you’ll know you’ve made an impact.
If you’re using paid promotional tactics to distribute your content, you can use a discovery platform like Taboola to track your results.
Challenges in Measuring ROI
Measuring ROI is both an art and a science. It’s not based on a single metric, so not everyone will agree on how to gauge the ROI of a particular content campaign. There are other challenges in measuring ROI that have to do with the fact that no matter how good your KPIs are, sometimes there is no 100% precise way to measure them. This could be for a number of reasons:
- Attribution tracking does not tell the whole story about what decisions led a user to purchase a product. A specific article or CTA could well be the reason for a purchase, but the metrics won’t reflect that if, for example, several days have elapsed between the event and the purchase.
- There are too many devices to track. You might look at a piece of content on your laptop at home, then switch to your phone when you get on the subway, then switch to your work computer. This makes it harder to make a one-to-one correspondence between a certain event and an uptick in a given KPI.
- The intangibles are hard to measure. A content campaign can have an effect on such factors as brand awareness and the company’s reputation or trust rating, but it’s not clear how such factors would be quantified.
Tools for Tracking Content Marketing Performance
In addition to Google Analytics 4, which we discussed above, there are many tools at your disposal to track content marketing performance. Here are some of the more popular ones:
- Facebook Audience Insights: Free analytics tool for Facebook pages; access it here.
- Instagram Insights: Free analytics tool for Instagram accounts. You access this directly through Instagram by going to Menu > For Professionals > Insights.
- Buzzsumo: Their platform allows you to create alerts for key influencers, bloggers and journalists so you can be first to engage with their content.
- Semrush’s Keyword Overview: This tool allows you to track analytics of certain keywords.
Key Takeaways
- Content marketing ROI is a comparison of a percentage that results from comparing the cost of creating and distributing content, versus the net profit that resulted from those efforts, expressed as a percentage.
- There are a number of metrics that you can use to track your content’s ROI, including organic traffic, lead generation, conversion rate, and many others.
- Ultimately, you should strive to measure your content’s impact on sales and revenue, even if your efforts sit more towards the top of the funnel.
Frequently Asked Questions (FAQs)
What is a Good ROI for Content Marketing?
Experts say that for content marketing, 500% is a gold standard and a highly aspirational goal. Anything less than 0% means that the cost of your content is greater than the revenue it generated. 100% ROI means you doubled your investment.
What is the Success Rate of Content Marketing?
According to a 2024 survey from the Content Marketing Institute, 58% of marketers rate their content strategy as “moderately effective.” Nearly half of those say their strategy struggles because they lack clear goals. Don’t let that happen to you!
What is the Average Cost of Content Marketing?
This runs the gamut: an Etsy shop might spend $500 a month; a small to medium-sized business might spend $1,000 to $5,000 per month, while a large corporation might spend $100,000 per month. You have to factor in costs such as infographics, videos, copywriters for website and blog posts.


